I love maps. There’s something about the representation of the world in a map that can really transform the way I think about the way people live. Here is a selection of some of my favorite maps that I came across in the past year and a bit of why I find them so fascinating.
World Maps
Humanity has spread across the earth, but not equally. The population density of this small circle is such that more than half of the people on earth live within the circle. The population density of this area, which includes incredibly unpopulated areas like the Himalayan Plateau and the Mongolian Steppes, is staggering.
9. http://imgur.com/r/MapPorn/NRefv2R
Taking an economic view of the world, we see how a map can show inequalities and injustices. In this map, we see the world divided into areas with combined GDPs of ~1 trillion dollars. On the one hand, you have micro-regions like New York City and Tokyo, both of which are regions unto themselves. On the other hand, you have regions that encompass half of Africa, showing the unequal distribution of wealth across the world.
Sports Maps
8. http://cdn1.vox-cdn.com/assets/4706904/Popularsports.PNG
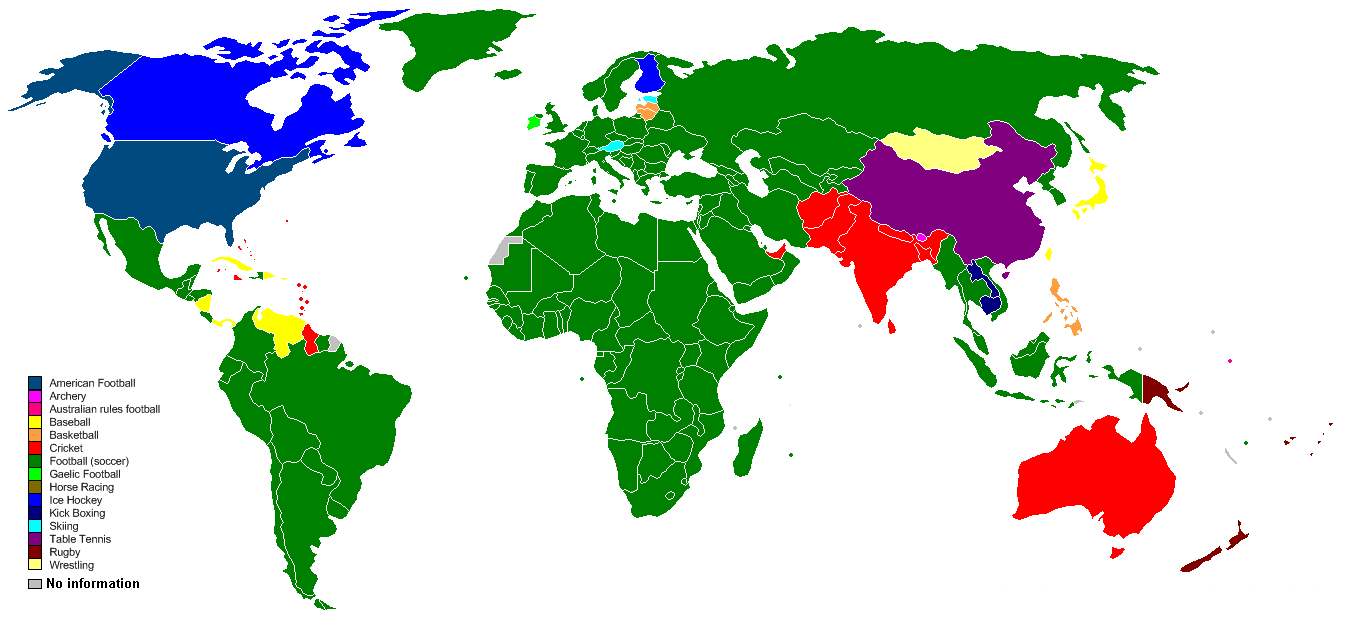
Maps can be about more than just economics and population. Sports provide some interesting information. Global sports fandom is a surprisingly variable thing. On the one hand, a map like this shows how dominant soccer is globally, dominating Europe, Africa, Western Asia and most of South America. It shows how cricket continues to dominate former British territories and how baseball dominates parts of Latin America. But the most interesting are the really regional sports tastes, like basketball in the Philippines and the Baltics, archery in Bhutan, Table Tennis in China and Football in the US.
7. http://i.kinja-img.com/gawker-media/image/upload/lygqkjqwwa94uzjgfwew.jpg
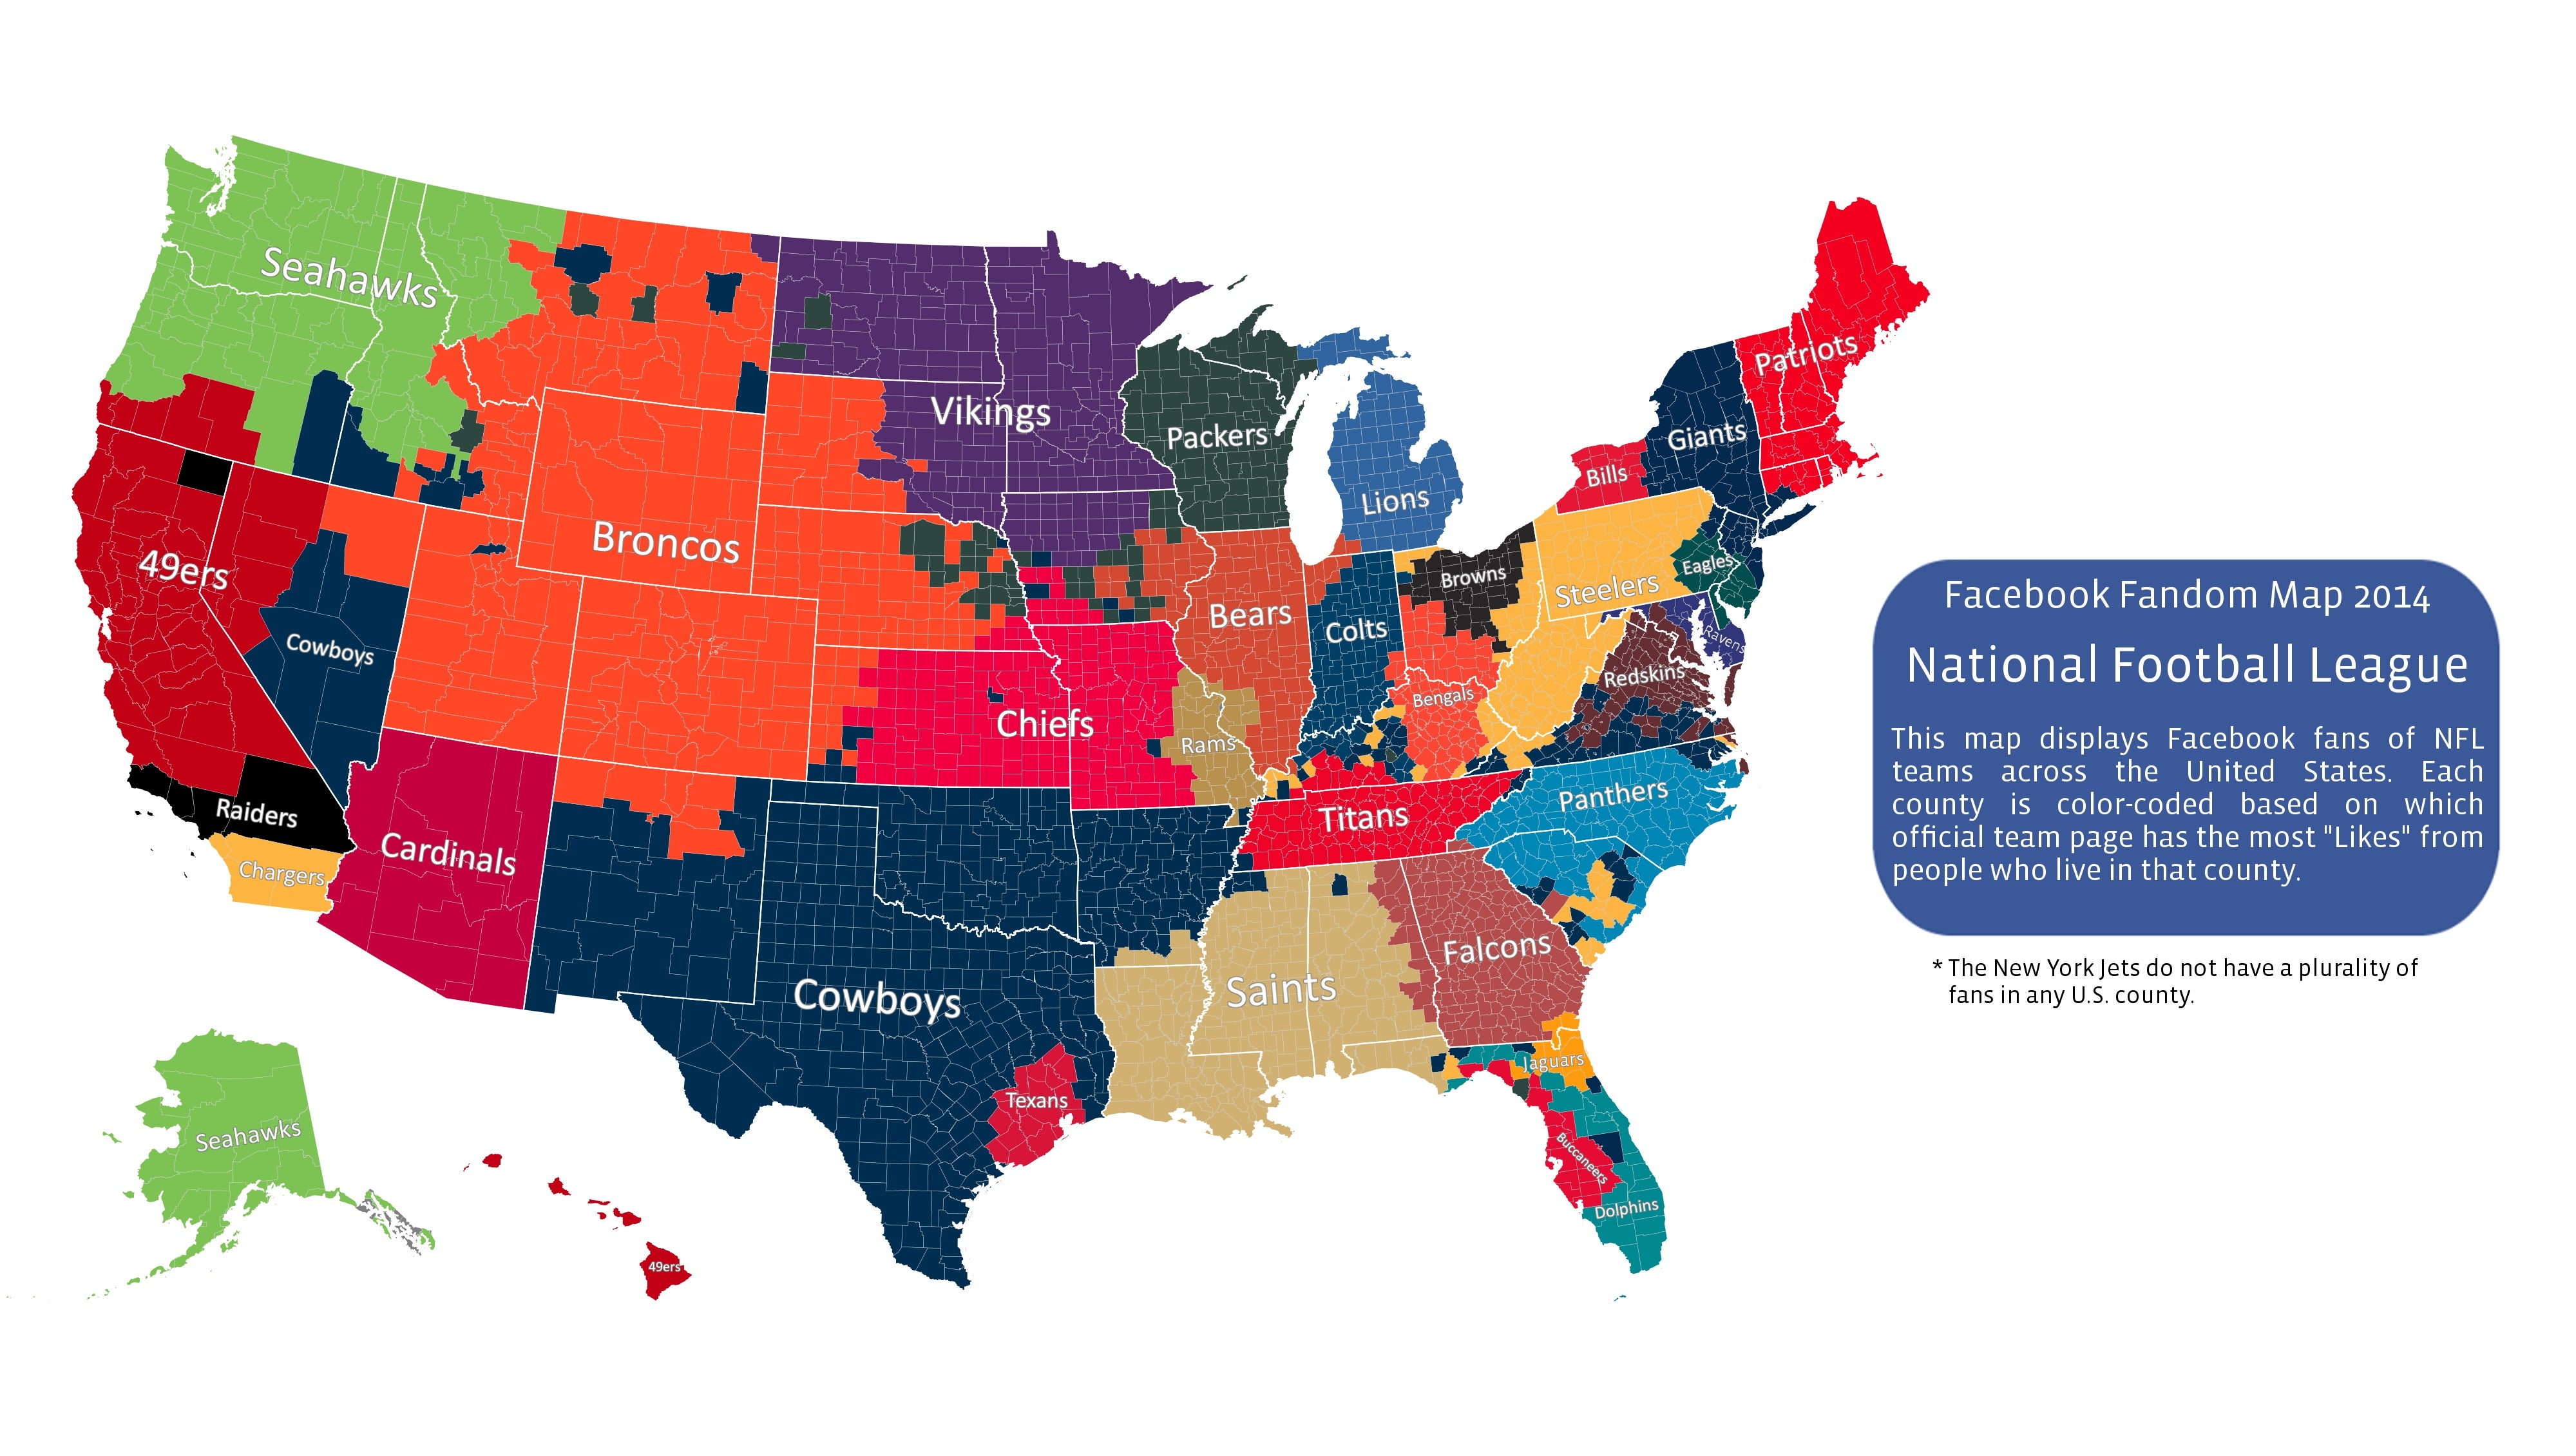
Speaking of Football, this map tracks Facebook Football fandom county by county marked by whoever has the most fans in a given county. Some of my favorite parts of the map are the patchwork of fandom in South Carolina, the enclave of Cowboys fans in Nevada, the Eagles-Steelers border in Eastern Pennsylvania and the clear Packers-Bears border at the Illinois-Wisconsin border. Of course, the saddest part is that the Jets aren’t the favorite team anywhere.
6. http://i.imgur.com/t451m3M.jpg
Sometimes, comparing two maps provides interesting information. The center of population in the United States has steadily been moving south-westward, between westward expansion and the development of air conditioning making the South habitable. Meanwhile the center of population for baseball players has been doing the same. What is interesting is that while baseball starts with more players from the Northeast during the period when baseball was confined to those states, as baseball moved west in the 50’s and 60’s, it followed the US population. Then, as more Latin American and Asian players began to enter the league, the population center moved further South and West as the new players came to be a major part of the American pastime.
Chicago Maps
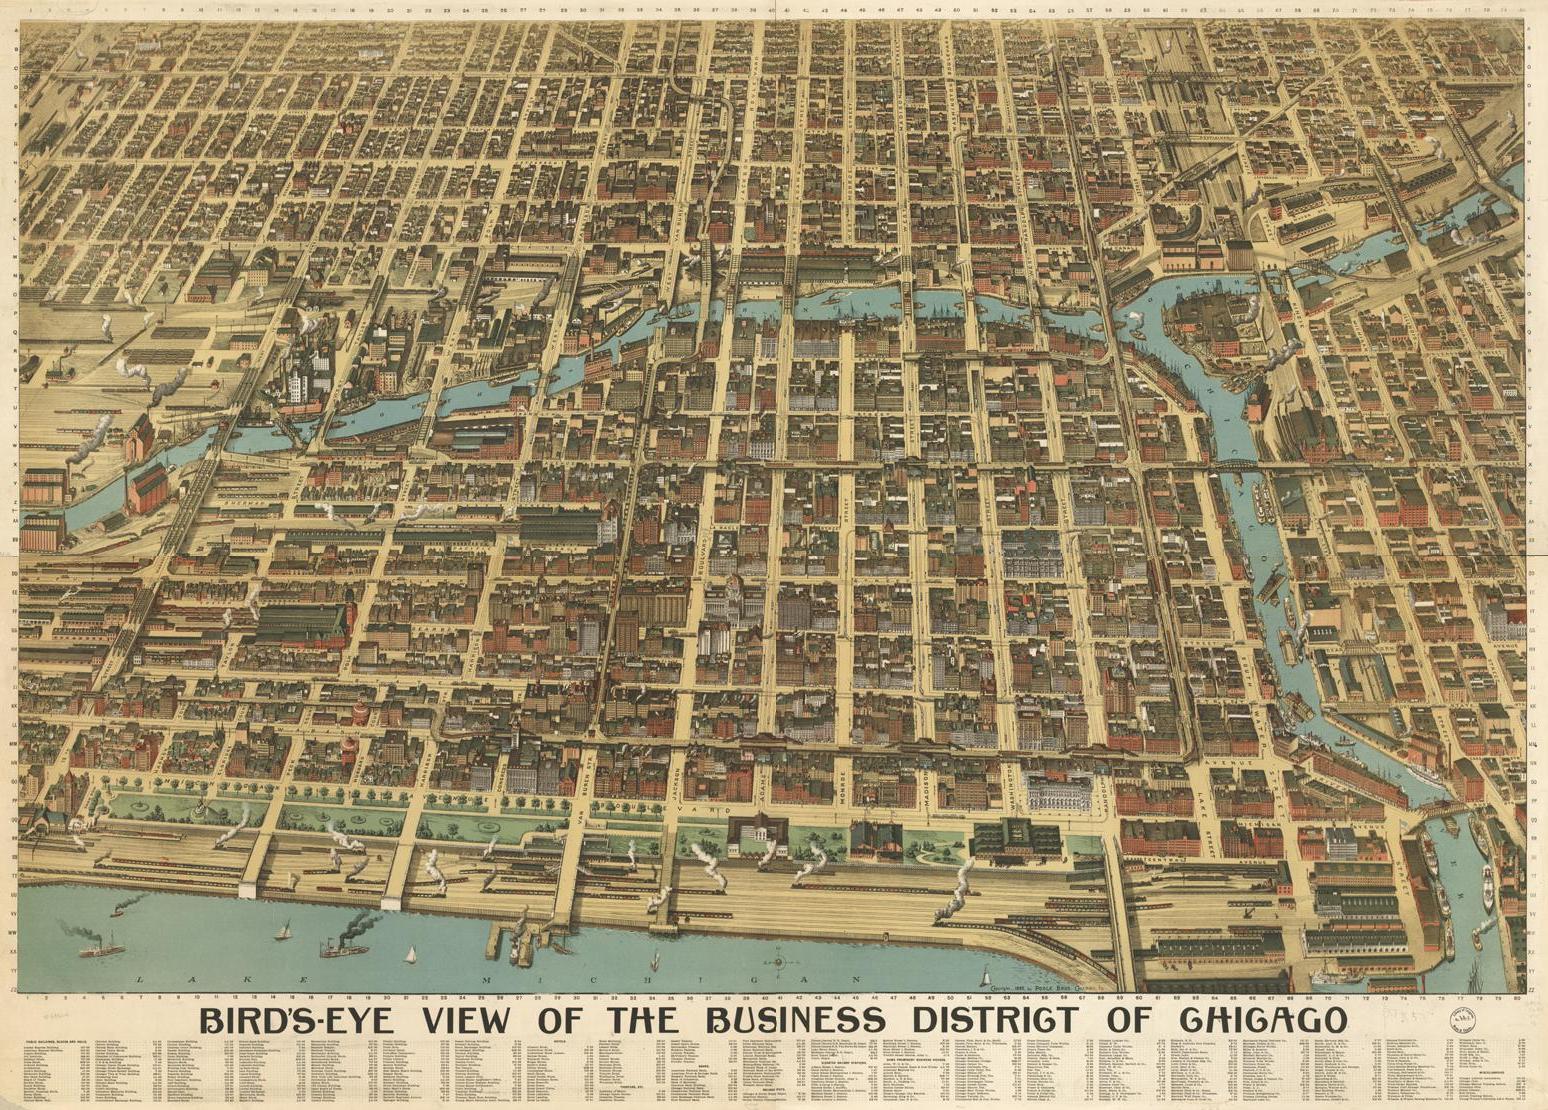
Maps of Chicago are some of my favorites as well. Looking at the historical business district of Chicago from 1898, after the fire reconstruction but before many of the modern buildings were put up shows a very different view of the Windy City. Instead of Grant Park, railroads dominate the lakefront. Boat docks are seen all along the river. And the elevated tracks of the loop are nowhere to be seen. But it is still recognizable as Chicago.
4. https://www.flickr.com/photos/10461908@N03/5785040748/sizes/l/in/faves-walkingsf/
Chicago as we know it has a distinct shape, one you can see on posters and t-shirts. But Chicago has not always contained all the parts it now does. This map details the 17 different annexations between 1847 and 1911. Of all these annexations, the ones from 1887 to 1889 are some of the most interesting, as they were specifically designed to boost the population numbers in anticipation of the 1890 census, trying to increase the prominence of Chicago before their bid for the Columbian Exposition in 1893.
3. http://chicagoist.com/attachments/chicagoist_chuck/2013_3_22_homicideheatmapschoolclosures.jpg
Sometimes, comparison maps can reveal complex overlap. This map includes a comparison of the heat-map of Chicago homicides in 2013 compared to the locations of schools closed as part of Rahm Emmanuel’s school closings. The large correlations, with large groups of school closing in close proximity to concentrations of violent crime show troubling connections. Maps can’t prove causation, but the correlation enough is troubling.
Historical Maps
2. http://upload.wikimedia.org/wikipedia/commons/5/54/Territories_of_Dynasties_in_China.gif
Maps in motion can show some fascinating things. This .gif of the changes in China’s borders show the way in which national identity is not solely fixed to geography. Even for such a powerful nation as China, the territory associated with the nation has seen periods of disunity, periods that have drawn in other areas such as Tibet and Mongolia and expanded from North to South.
1. http://upload.wikimedia.org/wikipedia/commons/2/29/Minard.png
This one is a classic and is a borderline map/infographic. But as a major part of it is the geographical representation, I wanted to include it. This map represents the advance of Napoleon’s army towards Moscow and then it’s eventual retreat. The width of the line represents the size of the army through the campaign, starting at 422,000 crossing the Nieman River with only 10,000 returning by the end. At the bottom is a measurement of the temperature during the retreat, as the cold decimated the remaining army. This is such an elegant presentation that it would seem a product of the modern age, but it’s actually from 1869.

